Applications view
This page shows how to use the Data Mechanics dashboard in order to monitor your live and recent Spark applications. It assumes that you know how to run a Spark application on Data Mechanics.
Applications list page
The default page of the Data Mechanics dashboard is the applications list page https://<your-cluster-url>/dashboard/apps/.
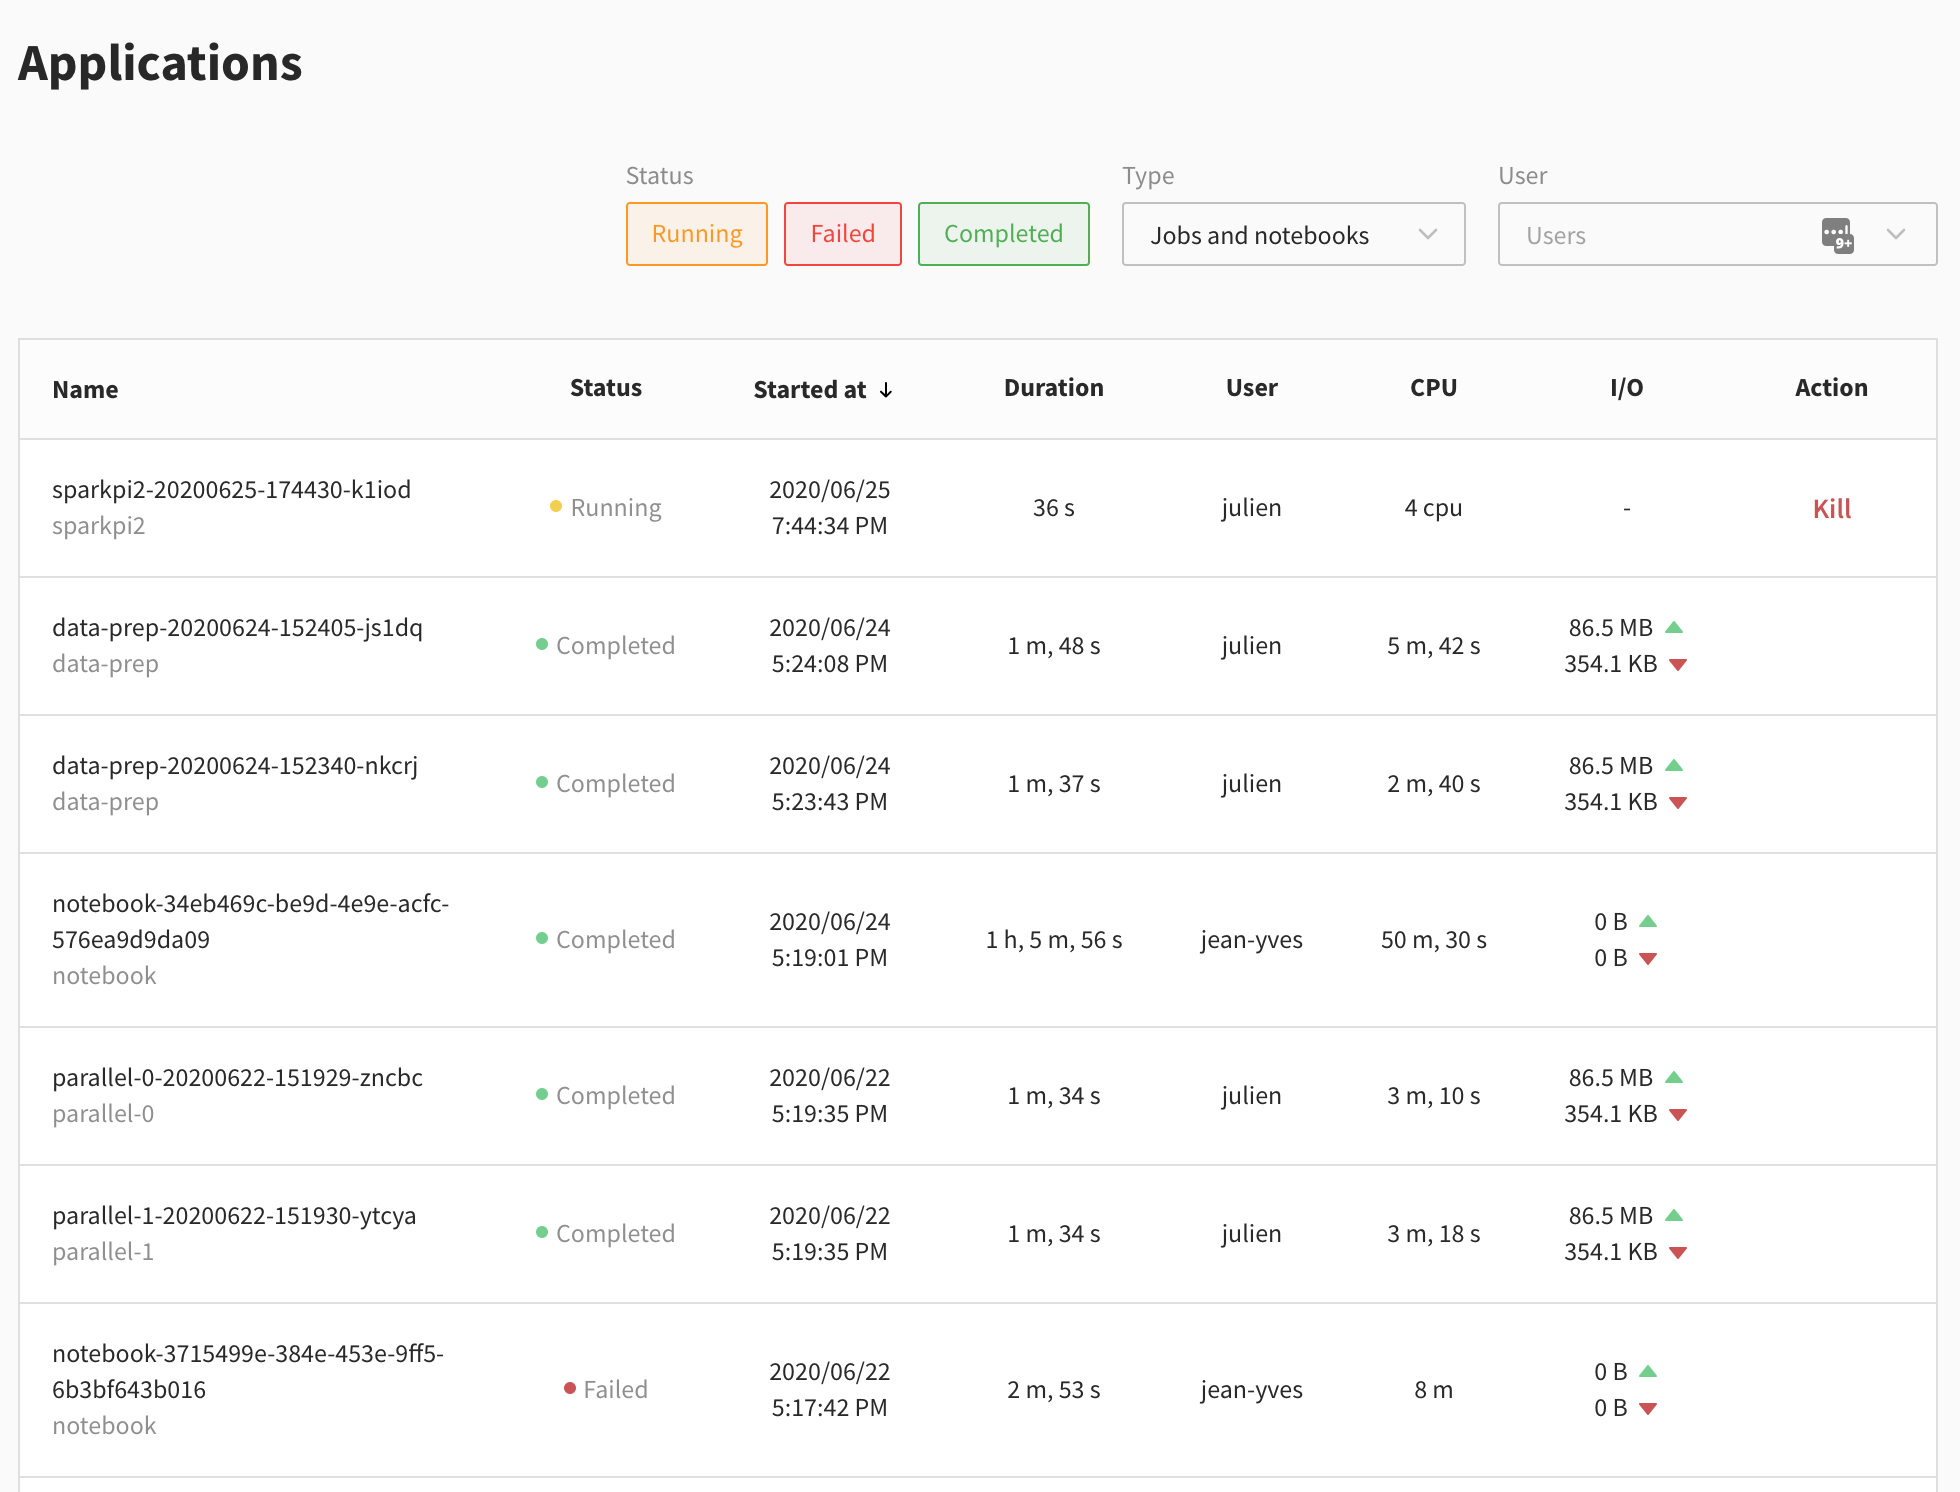
This page contains a table with a row for every Spark application recently run on the cluster. The information changes whether the app is live or completed.
The common fields are:
- the application name
- the job name
- the status: running, completed or failed
- the start time of the Spark application
- the duration of the Spark application
- the user who launched this application
Completed apps have detailed metrics about resource usage:
- the sum of CPU-hours used by resources provisioned for your Spark executors
- the data read and written from storage
An example for the sum of CPU-hours
If you ran a Spark application where each Spark executor has 3 CPU cores provisioned, and the application ran for exactly one hour and had 10 Spark executors all the time (meaning dynamic allocation was disabled), then this column should read "30 hours".
To compute these metrics, Data Mechanics relies on the Spark events log. We don't have it yet for running applications. So instead, the dashboard displays:
- the number of CPU cores provisioned for your Spark executors
- an action button to kill the Spark application.
When the application finishes, it takes about a minute to compute the detailed metrics.
Clicking on a row takes you to the application page of this application.
Application page
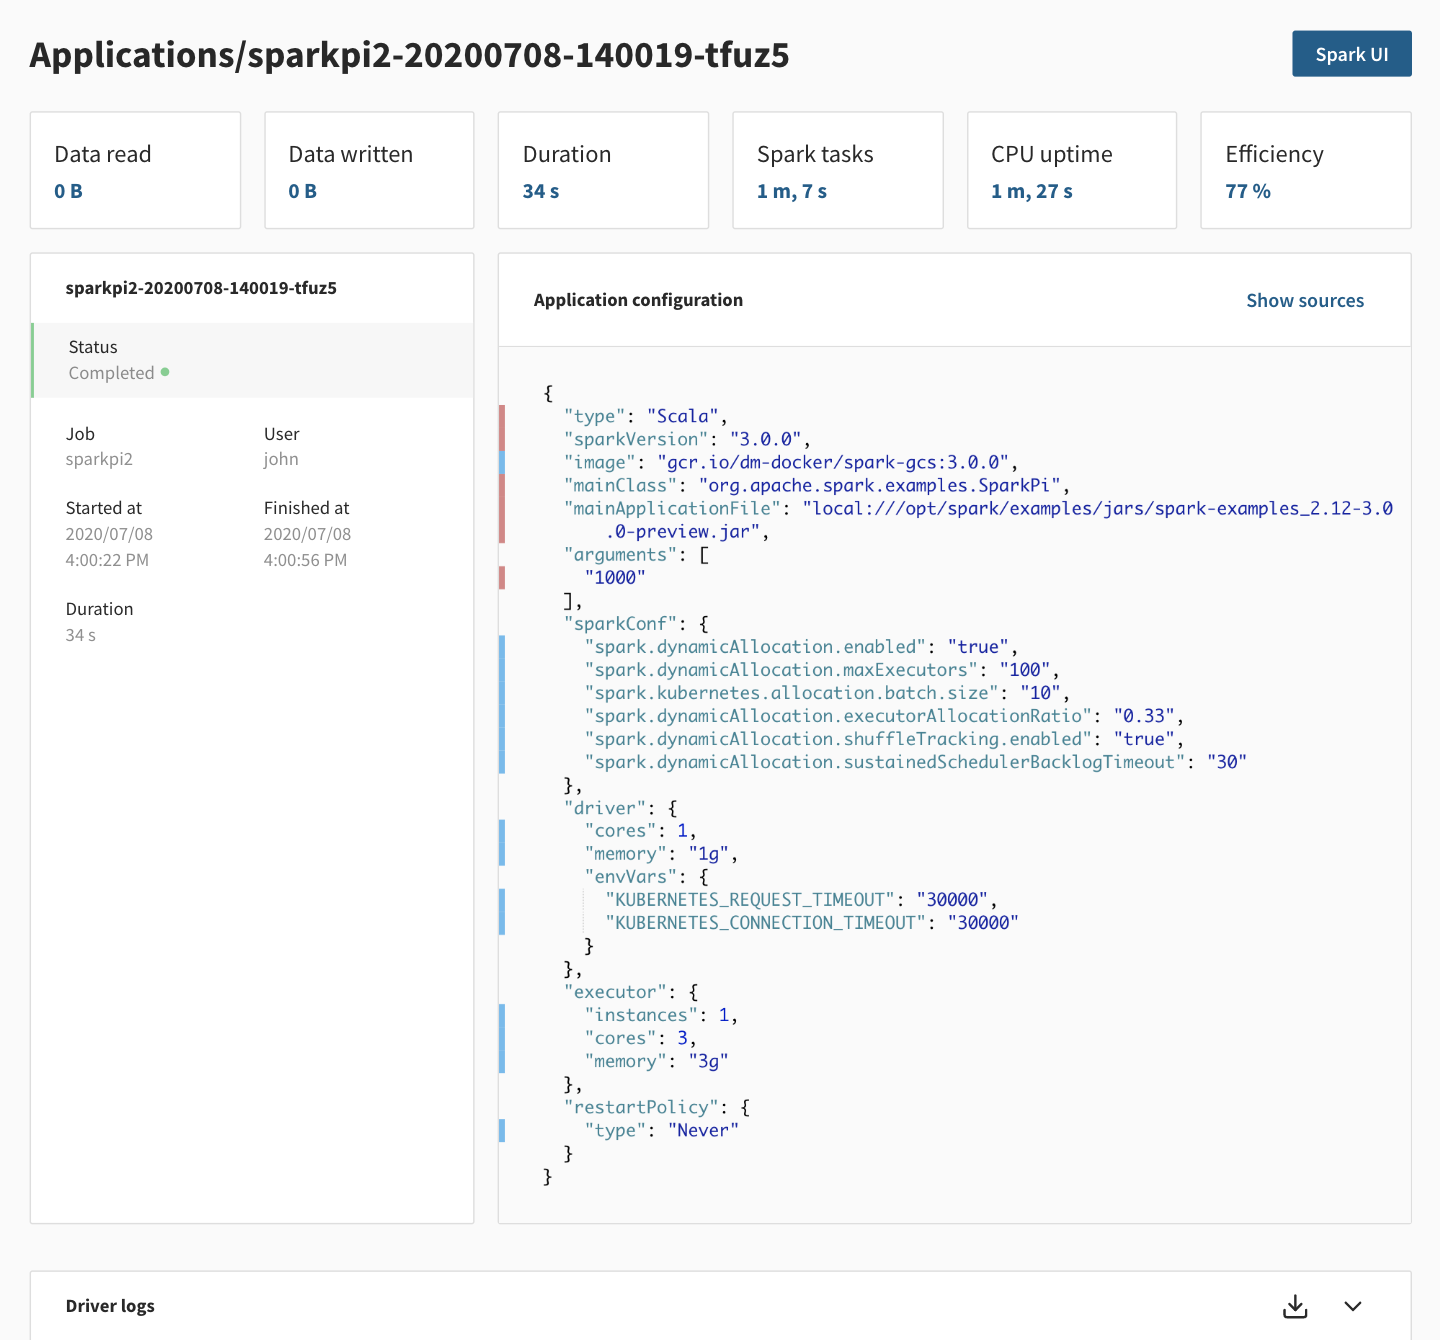
This page contains more information about a specific Spark application.
On the top right corner, there is a link to the live Spark UI for running applications and to the Spark History Server for completed applications. Note that the Spark History Server can take a minute to be up.
For running applications, a kill button is available near the Spark UI link.
In the body of the page, the first row of cards gives you important metrics:
- Data read and written from storage
- App duration
- Spark Tasks: the sum of the duration of all the Spark tasks in the app, as reported by Spark in the Spark event logs. This metric represents the total amount of time that CPU cores were effectively used for real work. This metric is used by our pricing.
- CPU Uptime: the sum of CPU-hours used by resources provisioned for your Spark executors
- Efficiency: the ratio of Spark Tasks over CPU Uptime. A low Efficiency means there's wasted compute in your application
Data Mechanics auto-tuning will attempt to increase the Efficiency of your applications while maintaining stability.
The next panel contains the configuration of the Spark application.
This is exactly the same object as the config in the payload returned by the Data Mechanics API when submitting an application with POST https://<your-cluster-url>/api/apps/.
You can see the source for each configuration option by clicking show sources, to help you differentiate between the configuration you defined, from the one injected by Data Mechanics during the auto-tuning. See the configuration management page for more details on the different sources and their precedence.
The last panel shows a live stream of the Spark driver log for running applications, and a download link when the app is completed.