Jobs view
This page explains how to use the Data Mechanics dashboard in order to monitor the performance of your workloads over time.
Jobs are scheduled applications. For example, a Spark application that you run every day, or every hour, is a job in Data Mechanics.
Remember your first Spark application: you defined a jobName for your Spark application in the payload of the API request.
All subsequent apps with the same jobName will be grouped together in the dashboard so you can monitor their performance over time.
Let's take a look!
Jobs list page

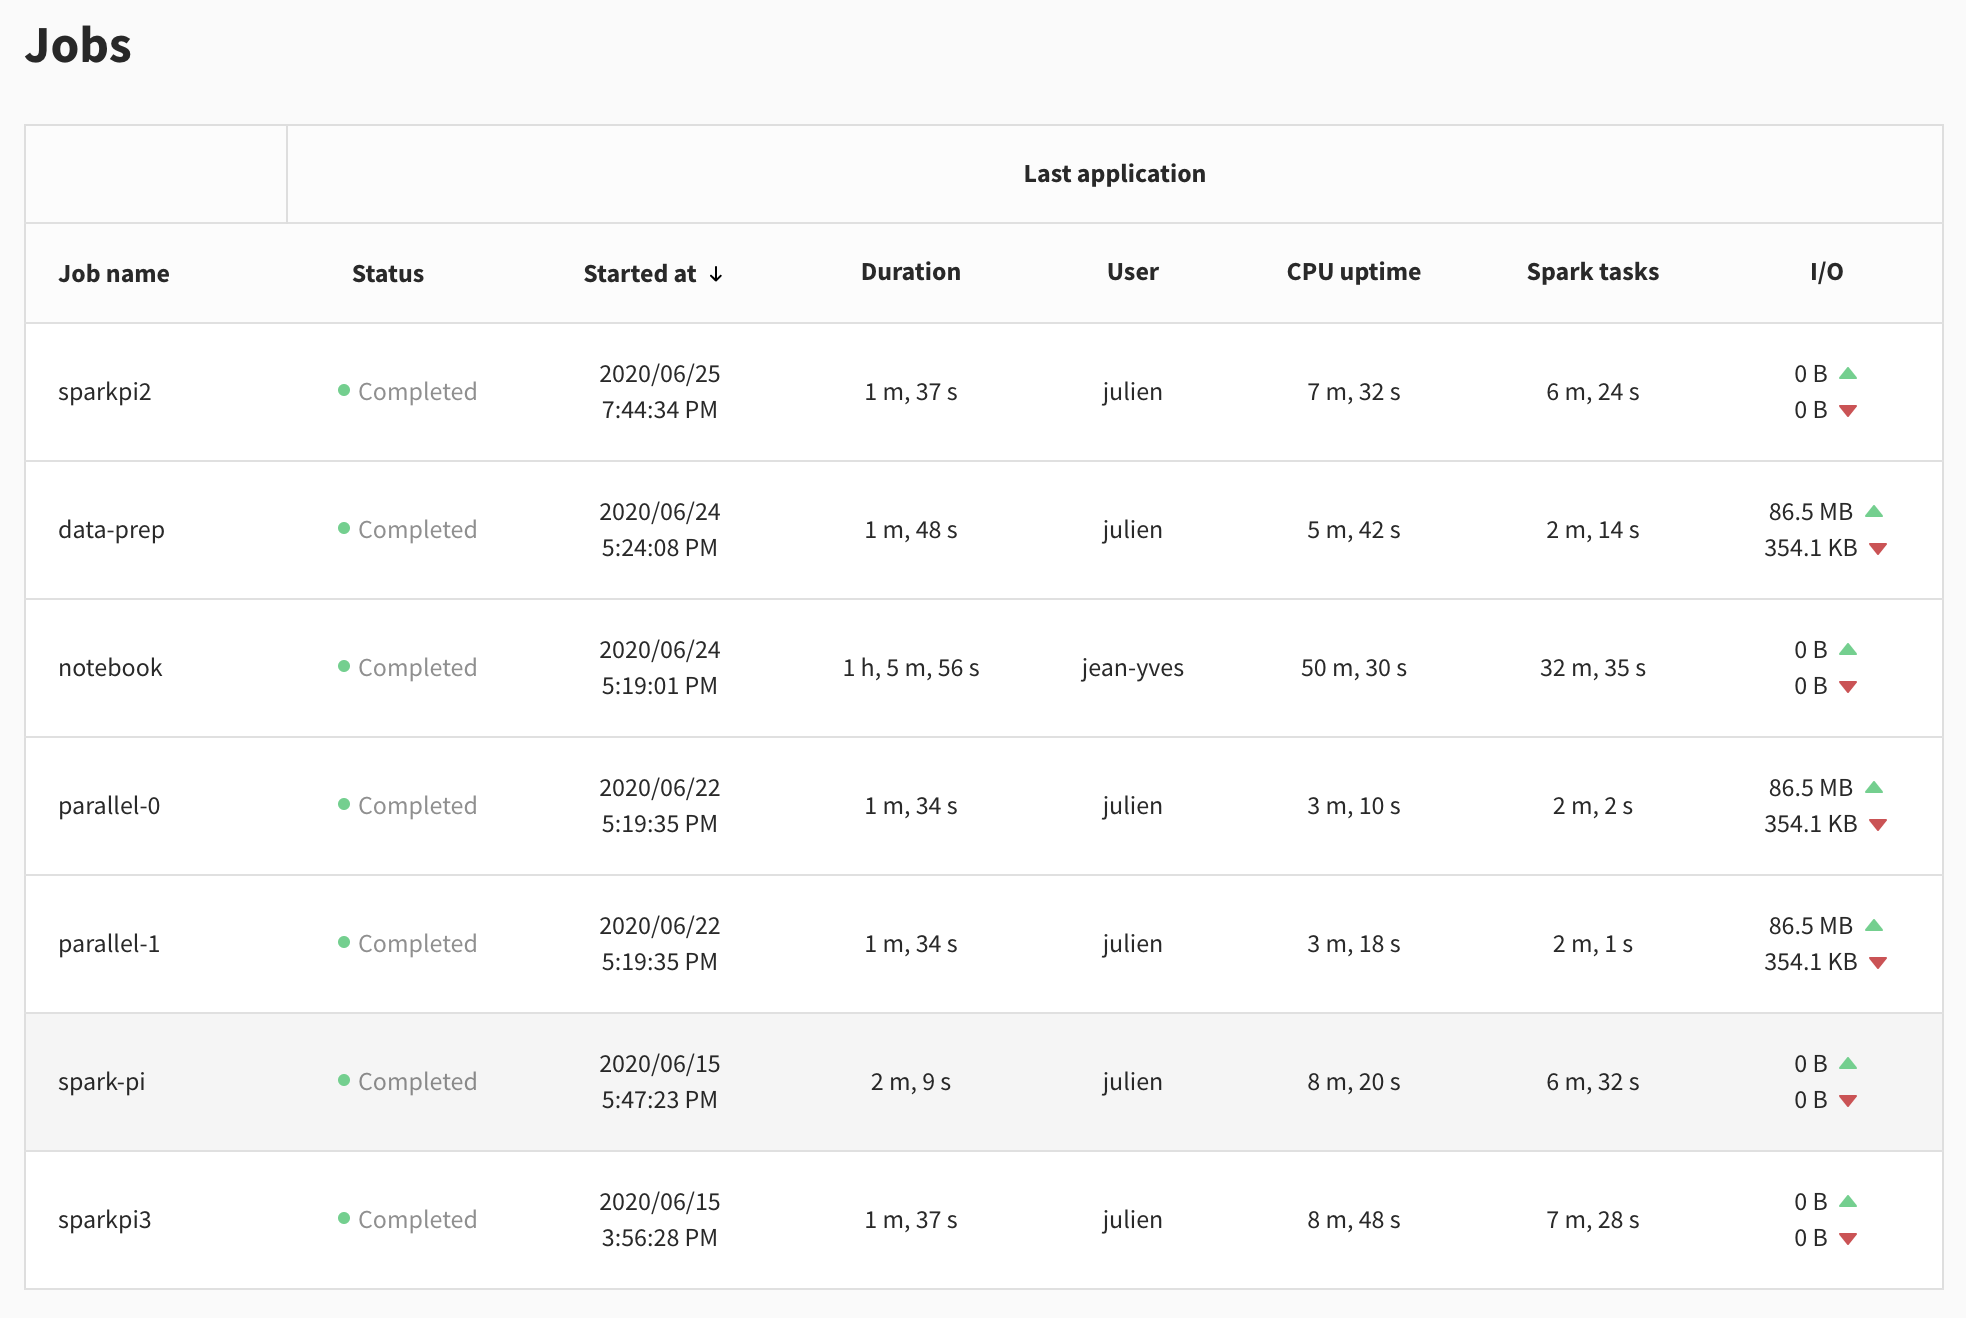
Except for the job name, this page looks a lot like the Applications view. That's because it gives detailed information about the last app of every job.
On this page, you get an overview of all the workloads scheduled on Data Mechanics. You can check if any of them failed last night, or if anything is out of the ordinary.
Clicking on a row takes you to the job page of this application.
Job page

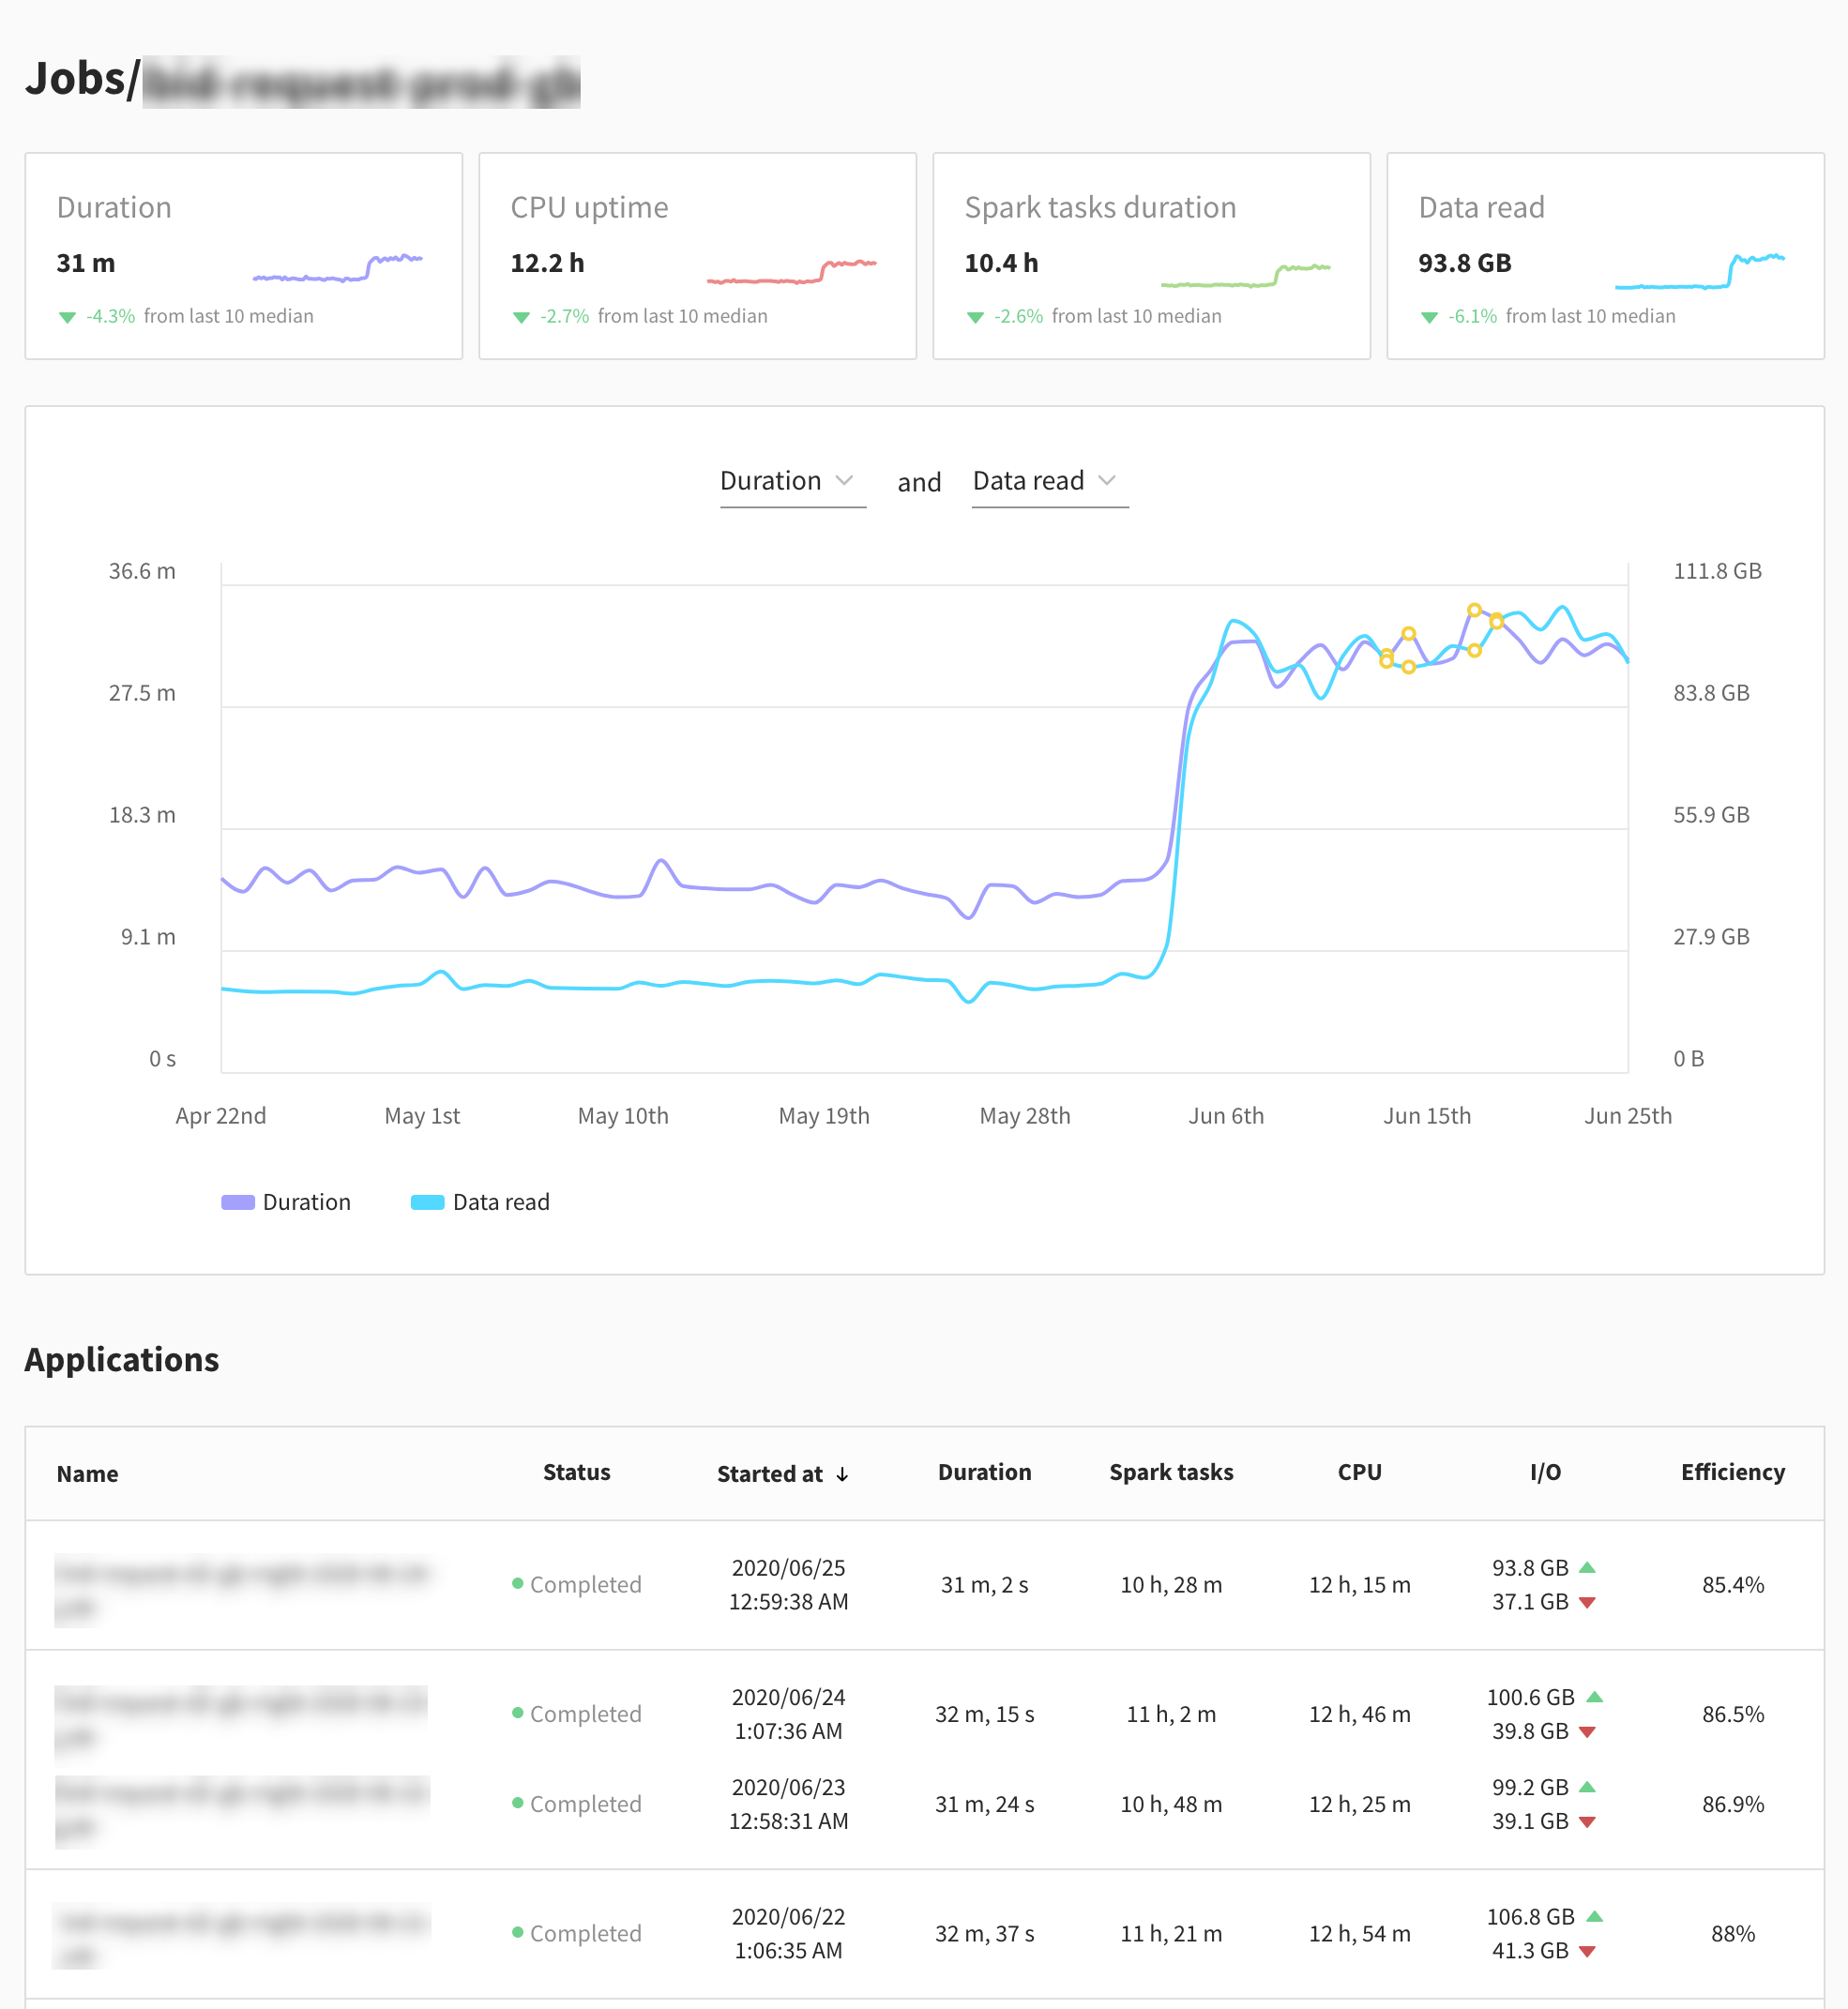
The first row of cards lets you compare at a glance the performance of the last application to that of the previous ones on a set of metrics.
- Duration of the app: you may have some deadlines not to exceed.
- CPU uptime: the sum of CPU hours used by your Spark executors. This is directly correlated to the cloud provider cost of your application.
- Spark tasks duration: the sum of the durations of Spark tasks in the app. If the Spark tasks duration is much lower than the CPU uptime, there's usually wasted resource and inefficiencies in your app.
- Data Read: the data read from the storage. All other metrics are usually correlated with the volume of input data.
Next, there is a plot of two metrics over time. It defaults to Duration and Data Read, but you can select any two metrics from Duration, Data Read, Data Written, CPU uptime and Spark tasks duration. This lets you see long-term trends in your workloads behavior.
Finally, the Job page contains the list of Spark applications in this job, in a table similar to that of the Applications view.